Observation accuracy enhancement
Abstract
The Tateno Aerological Observatory pursues research, development and improvement to address data errors stemming from differences among instrument models and individual units in atmospheric observation. Efforts to enhance precision in GPS sonde and ozonesonde accuracy are described below.
GPS sonde observation data enhancement
Special ground inspection equipment is used to measure humidity and enhance GPS sonde observation data accuracy. Before sounding, each GPS sonde is checked in low-humidity (approx. 0% RH) and high-humidity (approx. 100%) environments, and various interconnected radiosonde flights are conducted to determine related characteristics. The resulting data are used to enhance processing algorithms and improve accuracy in reanalysis data from sources such as the GRUAN Data Product.
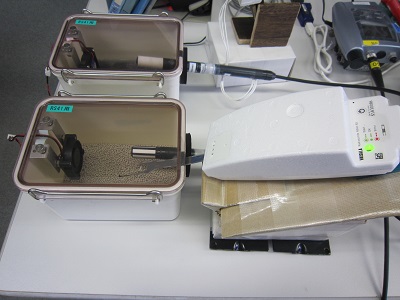
ground inspection equipment
Profiles obtained from dual-flight GPS sonde observation are shown below. On the left (regular observation data), a humidity difference is observed in data from two GPS sonde types. On the right (GDP data), the data correspond closely. This represents enhanced GPS sonde observation accuracy and better atmospheric profiling.
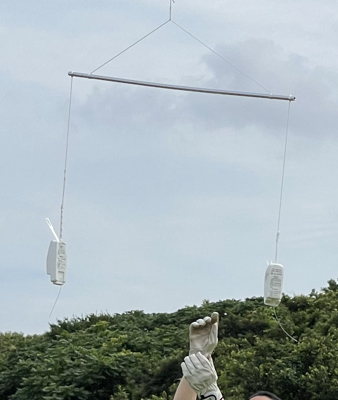
Dual-flight GPS sonde observation
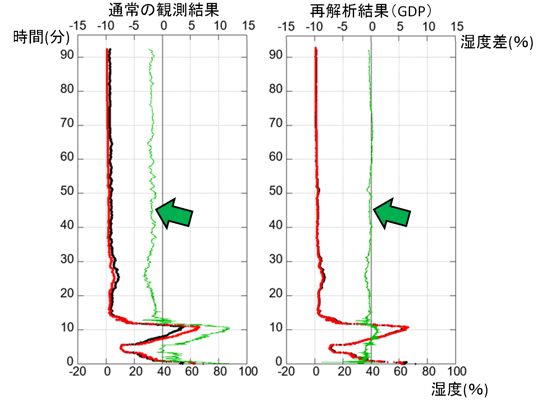
Humidity data from dual-flight GPS sondes (black and red) and humidity differences (green). GDP (right) is more accurate than normal observation data (left).
GDP is also more accurate for temperature, wind, altitude and pressure than normal observation data. GDP information and specifications are available on the GRUAN(GCOS Reference Upper-Air Network) website.
- GDP (NetCDF: for professional usage)
- Meisei GPS sonde specifications (GRUAN TD-5: for professional usage)
Ozonesonde observation data accuracy enhancement
Ozonesondes observe ozone concentration in the upper atmosphere by pumping in air. As pump performance varies (especially in low-pressure conditions), a pump efficiency measurement system is used to research individual differences in the range between surface pressure and 3 hPa.
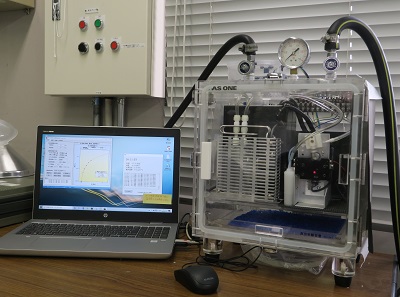
Pump efficiency measurement system
The pump performance results below equate lower pressure to lower pump performance (e.g., 30% worse at 5 hPa than at the surface), and each pump has a different performance curve. The pump efficiency measurement system supports highly accurate ozonesonde data with the effects of pressure and individual differences removed.
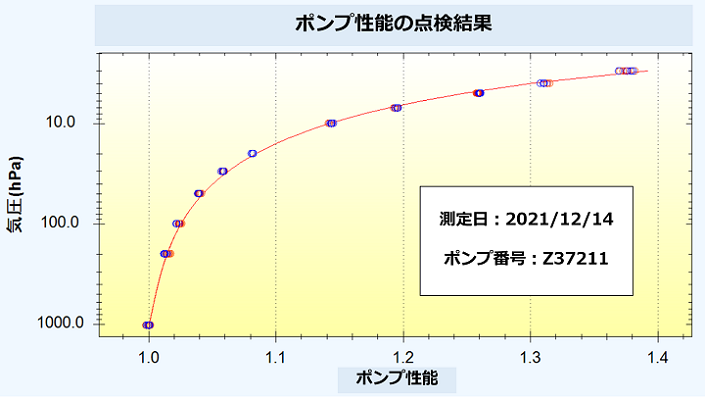
Pump performance
Circles: observation data; horizontal axis: pump performance. Higher values represent lower pump performance.
Ozonesonde observation data and pump efficiency measurement system specifications are available as listed below.
- Ozonesonde observation data (WOUDC: World Ozone and Ultraviolet Radiation Data Centre; for professional usage)
- Development of a Pump Efficiency Measurement System for Ozonesonde using the Bag Method Flowmeter (for professional usage)